Takeaways from the latest HSE statistics for outdoor sectors
HSE have released their annual health and safety report and statistics for 2024/25. Here’s Trackplot’s assessment of the figures for outdoor industries and key takeaways.

Health and Safety report takeways
-
1. Consider your contractors. They are a vulnerable subset of the workforce and you have a duty of care to those you hire. Ensure your Health & Safety Policy and Procedures covers what policies and measures you expect your contractors to have in place.
READ THE ARTICLE: Managing Health & Safety with contractors
-
2. Engage workers to identify hazards and prevent accidents. It’s proven that better health & safety brings better employee engagement which in turn increases productivity, reduces costs and boosts employee retention.
READ THE ARTICLE: Health & Safety: What’s in it for me?
-
3. Ensure your workers know what to do if they are involved in an emergency incident or are first on the scene.
READ THE ARTICLE: Emergency first aid to save a life
Unpicking the latest HSE statistics for outdoor sectors
The headline statistics for the industries that Trackplot supports are:
1. Fatalities
124 workers killed in work-related accidents.
The “Construction, civil engineering” and “Agriculture, Forestry and Fishing” sectors continue to account for the greatest number of workers killed in fatal accidents each year. Between them just under half of all fatal injuries to workers in 2024/25 are attributed to these sectors.
Fatalities by accident kind
Around 80% of all fatal injuries are accounted for by just 5 different accident kinds. 28% were due to fall from a height; 15% were due to being struck by a moving object and another 15% by being struck by a moving vehicle.
In the “Construction, civil engineering” sector over half of all deaths were due to falls from a height.
In “Waste and recycling” sector 53% of deaths were due to being struck by a moving vehicle, 27% in “Transportation and storage” and 27% in “Agriculture, Forestry and Fishing” compared to 15% across all sectors.
Employment status
Around 40% of fatal injuries to workers in 2024/25 were to the self-employed even though they make up only 15% of the workforce.
The overall fatal injury rate for the self-employed for the five-year period 2020/21-2024/25 is around 3 times that of the employee rate.
In “Agriculture, Forestry and Fishing” 66% of deaths were to the self-employed, 45% in “Construction, civil engineering” sector.

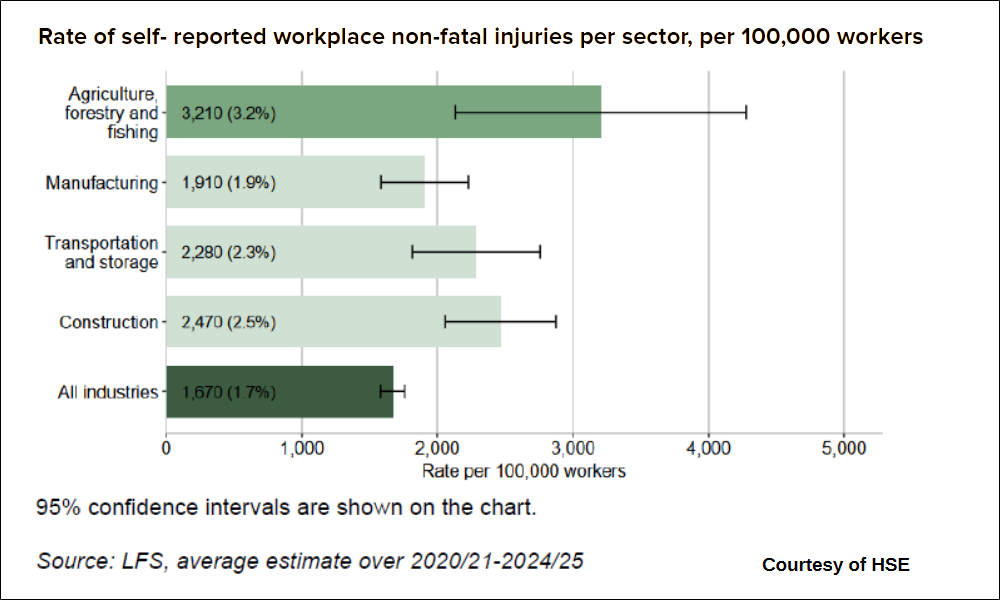
2. Workplace injury
680,000 workers sustained a workplace non-fatal injury.
4.4 million working days were lost as a result of workplace non-fatal injuries.
In “Construction, civil engineering” 50,000 workers sustained a workplace non-fatal injury; 40,000 in “Transportation and storage”; 8,000 in “Agriculture, Forestry and Fishing”; 4,000 in “Waste collection, treatment, disposal”, all of which are higher than across all industries.
3. Economic cost
Total cost of all work-related ill health and injury is £22.9 billion.
£6.5 billion annual costs due to workplace injury in 2024/25.
Per sector the cost of all work-related ill health and injury is (2023/24):
Construction / civil engineering £1.4 billion
Transportation and storage £1.4 billion
Agriculture, Forestry and Fishing £67 – £213 million
An estimated 16,321 workers leave the labour market permanently annually as a result of a workplace injury or work-related ill health. These people are important as their cases typically incur large costs, resulting in lost income and production for the remainder of their working lives, and requiring greater healthcare costs.
READ THE HSE REPORT: Key figures for Great Britain 2024 to 2025